Narrative
Section 1: Changing Perceptions of Airline Safety
Data Visualization 1: Airlines’ Monthly Passenger Count by Year (2005-2024).
Trends in Airline Passenger Volume
In Data Visualization 1, we can see that the monthly passenger count as a whole has steadily increased over time. However, we do notice a big drop in passenger counts from 2020-2022, which is due to COVID-19 rather than an aviation accident. From this trend, it suggests that air travel has expanded significantly, with airlines serving more passengers than ever. However, many people still report a fear of flying. As discussed in Section 2, historically, many passengers will steer clear of flying after a major accident, and even today, airline safety remains a concern. Headlines frequently highlight major crashes, creating an impression that flying is unreliable or dangerous. Yet, the data contradicts this perception as more people are flying than ever before.
Has Public Perception of Air Travel Safety Improved?
Safety remains one of the most important factors for many consumers with studies showing that people are willing to pay more for airlines with better safety records [9]. As aviation technology and regulations evolved and advanced over the years, the overall rate of accidents and fatalities has declined over time and safety has only gotten better with airlines learning from past incidents and mistakes [10]. While there is always room for improvement, modern aviation has become one of the safest modes of transportation [10]. All of these advances have led to an impressive statistic of 1 in 13 million (estimate) chance of dying in a plane crash, making it by far the safest form of transportation [1]. In fact, even knowing this statistic can heavily influence a traveler’s choice for a flight with studies showing that effectively presenting safety information can strongly influence a traveler’s choice for a flight with a particular airline [9].
Examining Aviation Fatalities
Map Visualization 1: Foreign NTSB Aviation Accident Reports Fatalities (Excluding U.S.) Over Time.
Map Visualization 2: Domestic NTSB Aviation Accident Reports Fatalities Over Time
Millions of people fly each year and the fatality count is impressively low. Even more impressive is the decline in fatalities over 2 decades, as aviation safety measures continue to evolve. Despite these advances, many people still experience a fear of flying, even when they are aware of low accident rates. It’s not uncommon for people to perceive air travel as more dangerous than driving, even though airline fatalities are significantly lower than automobile-related deaths [3,9,19]. In fact, for those who deeply fear flying, they will pay much more just to help alleviate this anxiety, especially when considering how much they will pay for a safer automobile trip [3].
The Role of Media in Amplifying Fear of Flying
Furthermore, this fear of flying is exacerbated by the media, as news sources tend to focus on rare but dramatic crashes, leading to the perception that plane crashes are more common and flying is more dangerous than it is [7, 14, 15]. After a large crash, people’s trust in airlines often drops particularly if the cause is identified as pilot error, and often, it will take time before consumer confidence is restored [7, 8]. So, we see a disagreement between the statistics and the media because fatalities are lower than ever despite flying becoming more popular. More on the role of media in Section 3.
Shifting Attitudes Toward Airline Safety
Has improved aviation safety successfully reduced the fear of flying in society despite the negative press? There is limited research on whether the perception of flying as a safe mode of transportation has become more pervasive. However, it does appear that the younger generation is less afraid of flying [19]. And for those who do experience flight anxiety, factors such as quality service and a good smile can help alleviate their concerns and fear [19]. Given the significant advancements in aviation safety over the past 2 decades, it stands to reason that these improvements have contributed to the industry’s continued growth. This shift in perception of airline safety is also seen in passenger trends following airline incidents, as explored in Section 2.
Section 2: Passenger Trends After Airline Incidents
Accounting for Seasonal Trends
To get a better indication of how fear affects passengers’ decisions on flying, we need to account for seasonal trends. Certain months consistently have higher air travel demand than others, which could misrepresent the effect of an incident if we simply compare the months before and after. Looking back at Data Visualization 1 in Section 1, we can see that some months have a lot more people flying than other months. For example, at the peak of the year in August, a little over 3.5 million passengers are traveling compared to the low of the year, February when there are only 2.3 million passengers. These natural fluctuations make it difficult to determine whether changes in passenger traffic are due to the incident itself or normal seasonal variation.
For example, if there was an incident in September and we noticed a big drop in passenger count, the reason for the drop could be that flying is just out of season, so there’s usually a decline in passenger count anyway whether or not there was an incident or not. To illustrate this, the visualizations below compare the month before and after each incident to emphasize seasonal fluctuations:


Data Visualization 2a, 2b, and 2c: Comparison of Total Passengers Before and After Each Incident.
Analyzing Short-Term vs. Long-Term Passenger Trends After an Incident
To adjust for seasonal fluctuations, we calculated passenger percentages rather than raw counts. Using R, we computed the percentage of total yearly passengers who flew with the affected airline two months and four or five months after the incident and compared it to the other years or compared it to the average percentage. The formula used was:
Formula 1: Calculating Passenger Percentage After Incidents.
This approach allows us to analyze whether changes in passenger volume were incident-related rather than due to seasonal factors.
The three incidents and airlines we observed were: Comair Airlines incident in August 2006, Asiana Airlines incident in July 2013, and the Alaska Airlines incident in January 2024.

Data Visualization 3a: Comparing 2-Month vs. 4-Month Impact (2005-2024) for Comair Crash.
In the first incident, Comair Airlines (a subsidiary of Delta Airlines), we compared the passenger percentages 2 months and 4 months after the crash while accounting for seasonal trends. Based on trends from Data Visualization 1, October (2 months after the incident) and December (4 months after the incident) usually have the same amount of passengers around those times of the year at around 2.9 million passengers. This allows us to determine whether the reason behind the decline in passengers is due to the incident rather than seasonal factors. By looking at Data Visualization 3a, we observed a noticeable dip in passenger percentage 2 months and 4 months after the crash which could be an indication of fear in flying through Comair Airlines. Additionally, the decline was more pronounced after four months than after two months, which helps support the theory that the fear got even worse over time and it wasn’t just an initial shock to people. The graph shows the passenger percentage 4 months after the crash is 28.68% which is way below the average of 33.80%. This 5.12% difference from the long-term average for December across all years suggests a long-lasting impact on passenger volume, indicating that the crash may have influenced traveler decisions for Comair Airlines in the months following the crash.

Data Visualization 3b: Comparing 2-Month vs. 5-Month Impact (2005-2024) for Asiana Crash.
Moving on, we analyze the impact of the Asiana Airline crash that happened in San Francisco on July 6, 2013. This time, we are comparing the passenger percentage 2 months and 5 months after the crash, specifically examining September 2013 and December 2013. Looking at Data Visualization 3b, we see that there is a steep decline in passenger percentage in December (5 months after the crash) compared to that in September (2 months after the crash). The graph shows that the passenger percentage five months after the crash is 38.12%, compared to the average of 43.81%, indicating a 5.69% decrease. This suggests that it is likely that fear was induced in people from this accident because far fewer passengers were flying on Asiana Airlines after the incident happened, especially 5 months after the crash.

Data Visualization 3c: Comparing 2-Month vs. 5-Month Impact (2005-2024) for Alaska Incident.
Finally, we have our most recent incident in which Alaska Airlines was involved. This incident happened on January 5, 2024, in which a door of the plane blew out during flight causing the plane to make an emergency stop. There were no fatalities, but alarms were raised as to why this would ever happen. Looking at Data Visualization 3c, we compare passenger percentages two months after the incident (March) and five months after (June). The passenger percentage two months after the incident is 14.21%, which is close to the average of 14.19%, and five months after the incident, it is 40.76% which is near the average of 40.01%. Since these values remain in line with the average, we can’t say that the incident caused a substantial amount of fear enough to dissuade them from flying. From this, we can even say that fear of aviation could be getting better, at least for Alaska Airlines. This may be due to the fact there were no fatalities, making the event less severe compared to previous crashes.
Section 3: Media Sentiment and Passenger Volume
Media coverage plays a significant role in shaping public perception of airline incidents. To explore how media tone correlates with passenger volume, we examined three airline incidents: Comair Flight 5191 Crash (August 2006), Asiana Airlines Flight 214 Crash (July 2013), and Alaska Airlines Flight 1282 Incident (January 2024).
For each event, we analyzed three news articles published in the same month as the incident and used sentiment analysis to measure how negative or fear-driven the coverage was. Additionally, we examined media framing by analyzing key excerpts from the articles.
Sentiment Scores
To quantify how positive or negative the media coverage was, we applied two sentiment analysis scoring methods:
- Syuzhet Score: Analyzes emotional tone, where a lower score suggests higher levels of negativity, fear, or distress.
- AFINN Score: Assigned positive or negative numerical values to words where a lower score indicated more fear-driven, critical language.
The following table summarizes sentiment scores for the three airline crashes analyzed:
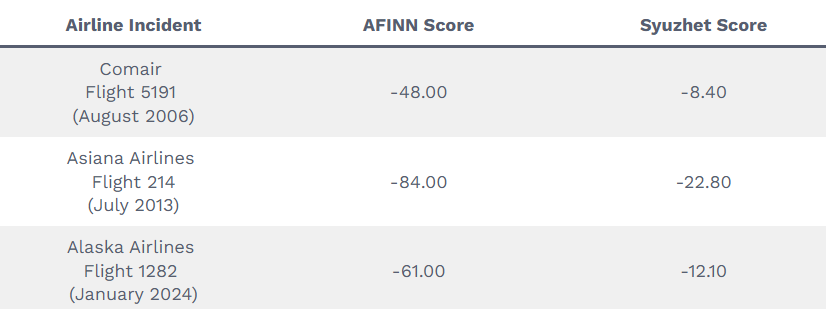
Among the three airline incidents analyzed, Asiana Airlines Flight 214 had the most negative sentiment scores, while Comair had the least negative coverage. While these scores help us quantify negativity, the words used in coverage provide further insight into how each incident was framed and how it might impact passengers’ confidence.
Media Framing and Fear-Driven Language
Comair Flight 5191 (August 2006)
The Comair Flight 5191 crash resulted from the aircraft attempting to takeoff on the wrong runway, which was too short for a safe departure. This accident led to the deaths of 49 out of 50 passengers.
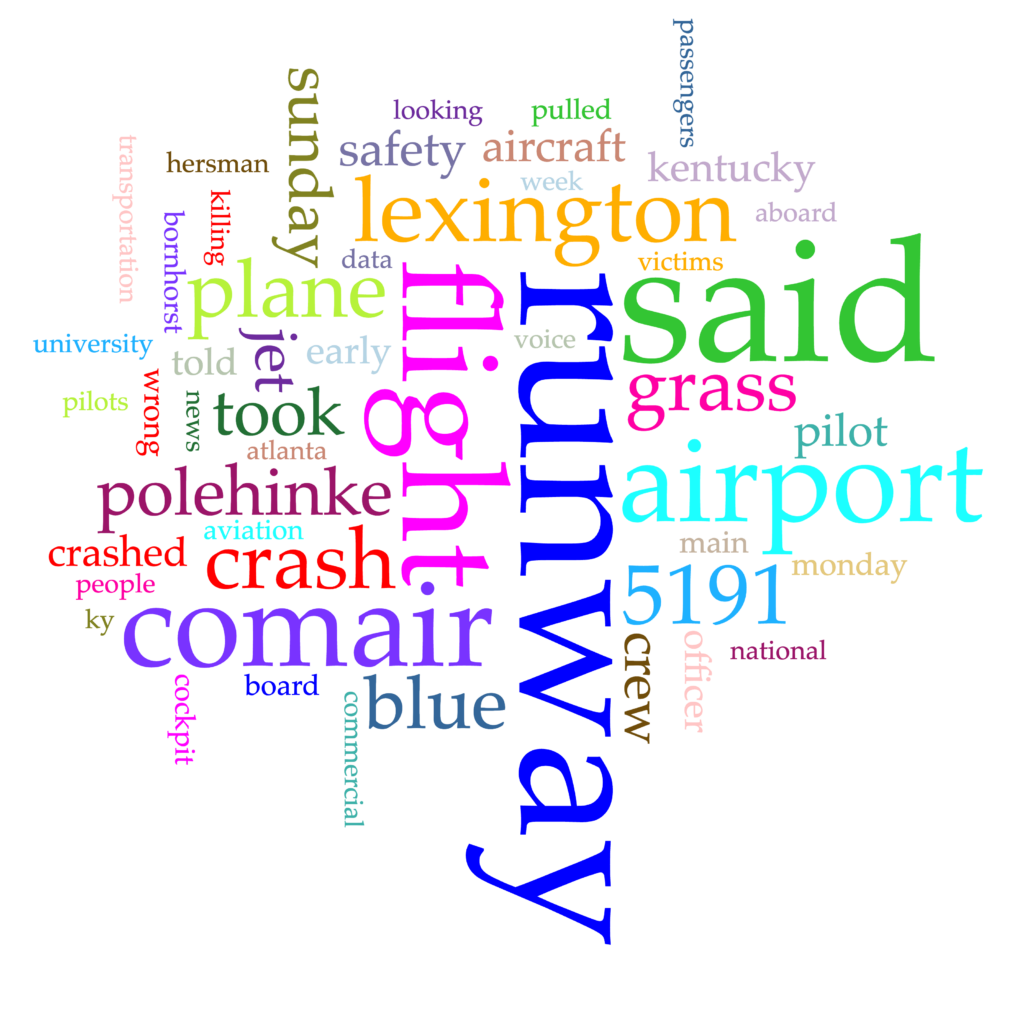
Word Cloud 1a: Comair Airlines’ News Articles Most Frequently Used Words
The Comair word cloud shows the most frequent words in media coverage which were “runway,” “flight,” “Comair,” and “airport,” showing that the focus was on the location and technical cause rather than emotional reactions.

Bubble Map 1a: Comair Airlines’ Most Negative Words in News Articles
The Comair bubble map highlights words like “victims”, “killing”, “failure”, and “warning”, showing that the media acknowledged the human cost of the crash. While terms like “wrong” and “failure” suggest a focus on procedural errors, the prominence of “victim” indicated that the loss of life was also a central theme in coverage.
Comair Media Framing
NBC News (2006) included a section titled “Pilot Suggested Warning”, highlighting prior concerns about Lexington Airport’s runway layout. This shifted blame away from the airline, portraying the crash as a navigation issue rather than a pilot or airline failure. ABC News (2006) included a statement from Comair’s president, stating that the pilots were “experienced and had been flying that airplane for some time”. By downplaying individual or airline responsibility, the media framed this as a systemic issue rather than a direct failure of Comair or the pilot.
Asiana Airlines Flight 214 (July 2013)
The Asiana Airlines Flight 214 crashed on approach to San Francisco International Airport (SFO), resulting in 3 deaths and 187 injuries.
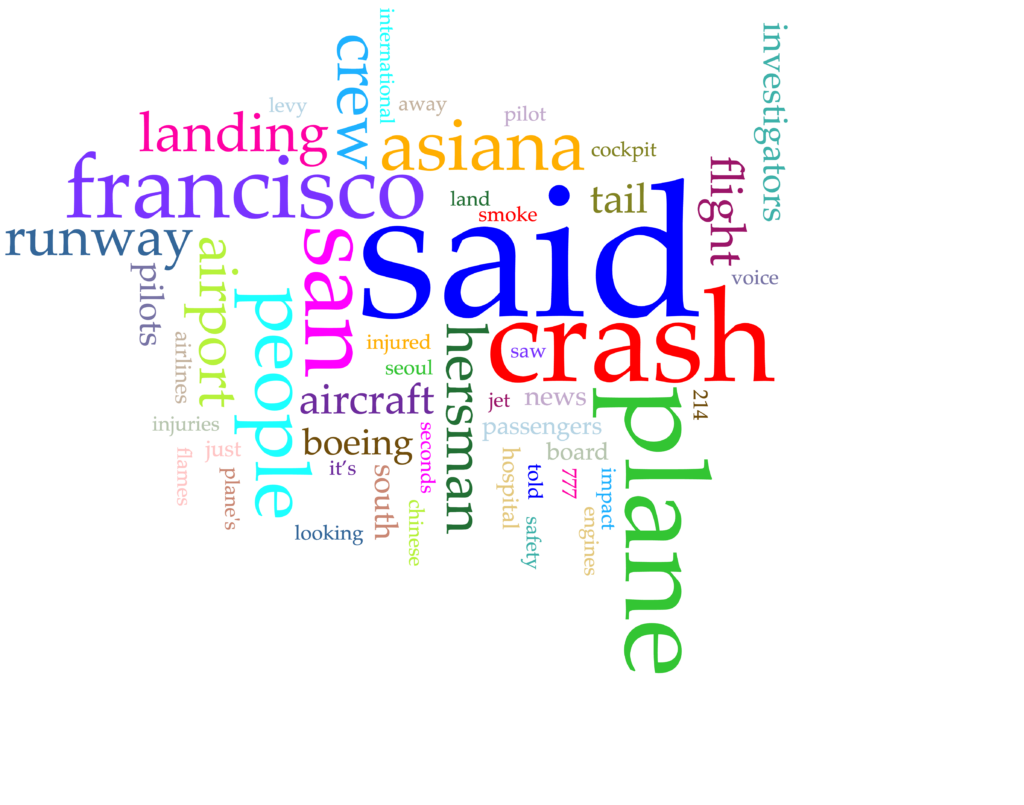
Word Cloud 1b: Asiana Airlines’ News Articles Most Frequently Used Words
The Asiana word cloud highlights words like “crash”, “plane”, “San Francisco”, “people”, and “landing”, showing that the media focused more on the location of the crash and the passengers rather than technical errors.

Bubble Map 1b: Asiana Airlines’ Most Negative Words in News Articles
The Asiana bubble map features words like “fire”, “emergency”, “fatalities”, “warning”, “victims”, and “died”, indicating that media coverage placed more emphasis on casualties and emergency response compared to Comair’s coverage.
Asiana Media Framing
BBC News (2013) framed the incident with alarming language, naming one section “Out of Control” and including a passenger quote: “there was chaos, disbelief, screaming”. While not directly blaming the pilots, Watkins (2013) from CNN dedicated a section to “Pilot’s Flight Record” and “The Frightening Crash”, subtly questioning experience levels and training. By questioning the pilot’s limited experience on the Boeing 777, media coverage reinforced concerns about pilot skill rather than external factors, influencing public perception of Asiana Airlines.
Alaska Airlines Flight 1282 (Jan 2024)
Unlike the other incidents, the Alaska Airlines Flight 1282 event was not a crash. Instead, it was a mid-flight emergency where a door plug detached, forcing an emergency landing. No fatalities were reported.
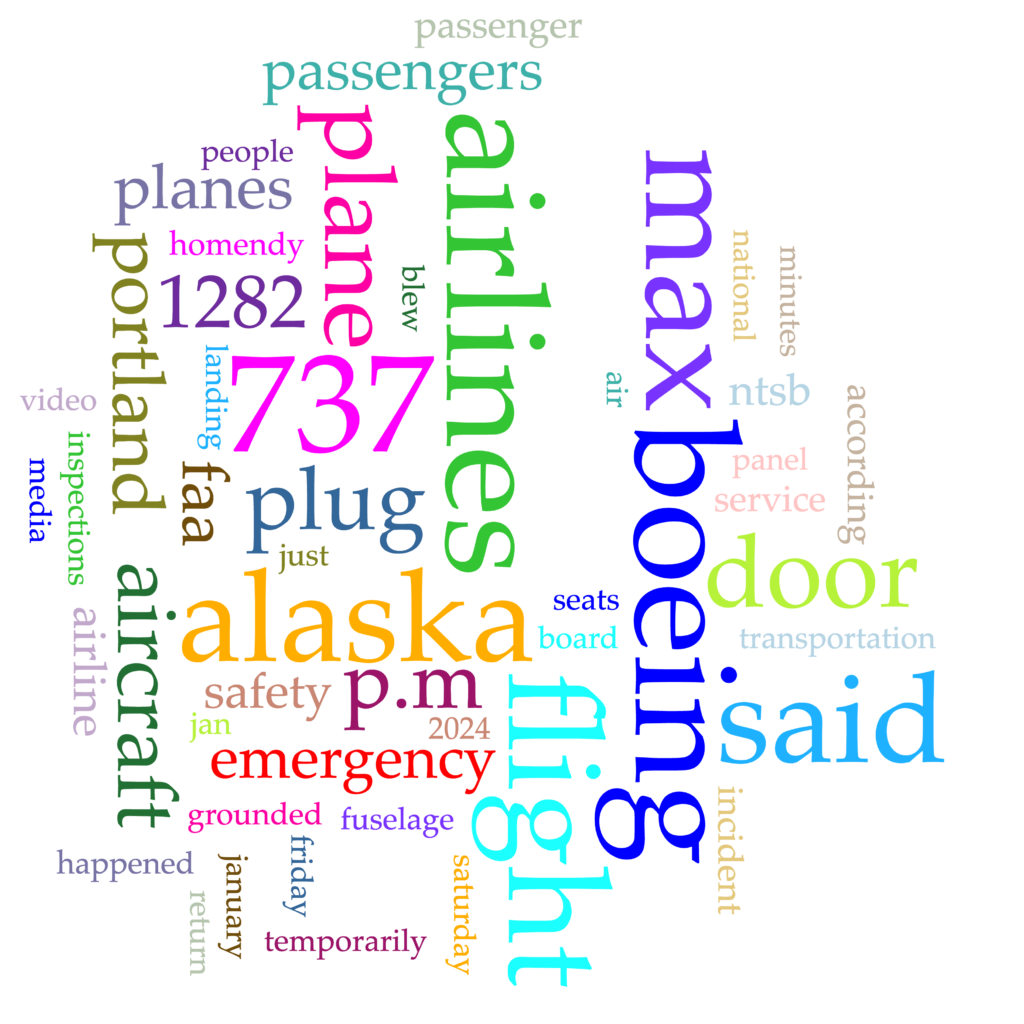
Word Cloud 1c: Alaska Airlines’ News Articles Most Frequently Used Words
The Alaska word cloud highlights words like “Alaska Airlines”, “Boeing”, “door”, “flight”, and “emergency”, meaning there was a lot of emphasis on Boeing aircraft and the airline.

Bubble Map 1c: Alaska Airlines’ Most Negative Words in News Articles
The Alaska bubble map still shows fear-driven words like “emergency”, “warning”, and “missing”, but words like “fatalities”, “killed”, and “death” (which were prominent in the other crashes) are mostly absent.
Alaska Media Framing
Ebrahimji (2024) from CNN included a section titled “Emergency lights tested and reset,” detailing prior pressurization warnings but describing maintenance responses “very normal”. Jacobo (2024) from ABC News highlighted how “The Boeing 737 Max has been under public scrutiny for several years following multiple crashes and malfunctions”, placing responsibility on Boeing rather than Alaska Airlines. This framing protected the airline from reputational harm, reinforcing power dynamics where manufacturers bear more blame than airline carriers.
Connecting Media Tone to Passenger Volume
This analysis explores whether airlines that received more negative media coverage saw a decline in passenger volume. Comparing sentiment scores with Section 2’s visualizations on post-2 vs post-4 or post-5 months passenger percentages, we observe varying trends:
- Comair Flight 5191 (2006): Had the least negative sentiment but still experienced a decline in passenger volume. Despite lower media negativity, passenger volume dropped below the average, suggesting external factors may also play a role in travel decisions.
- Asiana Airlines Flight 214 (2013): Had the most negative sentiment scores, and the airline experienced a significant decline in passengers. Given the intense focus on casualties and possible pilot inexperience, fear-driven media coverage may have influenced passenger decisions.
- Alaska Airlines Flight 1282 (2024): Despite the moderate negative sentiment, passenger volume remained stable. The absence of fatalities and the framing of the incident as a Boeing issue rather than an airline failure may have prevented a decline in passengers.
While this analysis suggests that highly negative media coverage may contribute to a decline in passenger volume (as seen with Asiana), the inconsistency in Comair’s decline despite less negative coverage indicates that other factors, such as airline reputation and crash severity, influence passenger behavior.
Conclusion and Key Findings
Research Question 1: In what ways has the perception of airline safety changed over the past years?
Our analysis showed that perception of airline safety has generally become slightly more negative over the past few years. Among the three incidents we examined, the earliest and deadliest accident (Comair Flight 5191 Crash) received the least negative media coverage. Meanwhile, the more recent accidents (Asiana Airlines Flight 214 Crash and Alaska Airlines Flight 1282 Incident) resulted in fewer deaths but received more negative scores for both sentiment tests. This trend may reflect the intensification of media bias and sensationalism, or an increased public awareness of aviation safety. Our analysis also revealed that over time, criticism and blame fell less on the pilots themselves and more on external factors. Media coverage for the Comair Flight 5191 Crash and Asiana Airlines Flight 214 Crash framed the incidents as resulting from pilot inexperience or errors, whereas the string of accidents that led up to Alaska Airlines Flight 1282 led the public to focus more on problematic procedures, regulations, and manufacturers.
Research Question 2: How does the frequency of fatal accidents affect a passenger’s likelihood of flying with a particular airline?
Our analysis examined how the frequency of fatal airline accidents influences passenger behavior. By comparing passenger percentages in the months following three different incidents, we observed various trends in post-incident passenger volume. For both Comair and Asiana, there was a decline in passenger percentage months after the crash, with a steeper drop observed over time. Comair’s passenger percentage four months after the crash compared to the average was 5.12% less, while Asiana’s passenger percentage five months after the crash was 5.69% below the average, suggesting a lasting impact on passenger decisions. This indicates that fatal accident may lead to long-term fear of flying with the affected airline. In contrast, the Alaska Airlines incident, which did not result in fatalities, did not show a substantial deviation from the airline’s passenger trends. Passenger percentages two and five months after the incident remained near the average. This suggests that incidents without fatalities may not have a lasting effect on passenger behavior. Overall, our findings suggest that fatal accidents have a stronger and more prolonged effect on passenger behavior, whereas non-fatal incidents do not necessarily cause much fear among passengers. This highlights the role of perceived safety and severity in shaping passengers’ willingness to continue flying with an airline.
Research Question 3: How does the tone of media coverage of an airline accident/incident correlate with changes in passenger volume?
Our analysis explored how media coverage of airline incidents influences public perception and passenger volume. Asiana Airlines Flight 214 (2013) had the most negative sentiment, with media coverage emphasizing chaos, injuries, and concerns about the pilot’s experience. While the media did not explicitly blame the pilot, highlighting his limited experience flying that specific aircraft model may have shaped public concerns about pilot expertise and contributed to a passenger decline. Alaska Airlines Flight 1282 (2024) had moderate negativity, but media narratives placed most of the blame on Boeing’s manufacturing failures rather than the airline itself, likely minimizing reputational damage and helping prevent a passenger decline. Comair Flight 5191 (2006) had less negative sentiment, with media coverage largely avoiding blame on the airline, and instead focusing on procedural failures and airport design issues. This relative silence may have shielded Comair from criticism, though its passenger volume was already below average, suggesting that external factors beyond media sentiment and framing may have played a role. These findings suggest that negative sentiment alone does not determine public decisions, media framing and external factors also matter. When blame is directed toward an airline or its pilots, the reputational consequences can be more severe. However, when external factors like manufacturing flaws or airport structure issues are emphasized, airlines may experience less criticism from the public, even if sentiment remains negative.